127.0.0.1 only - nothing leaves your machine.
The tabs
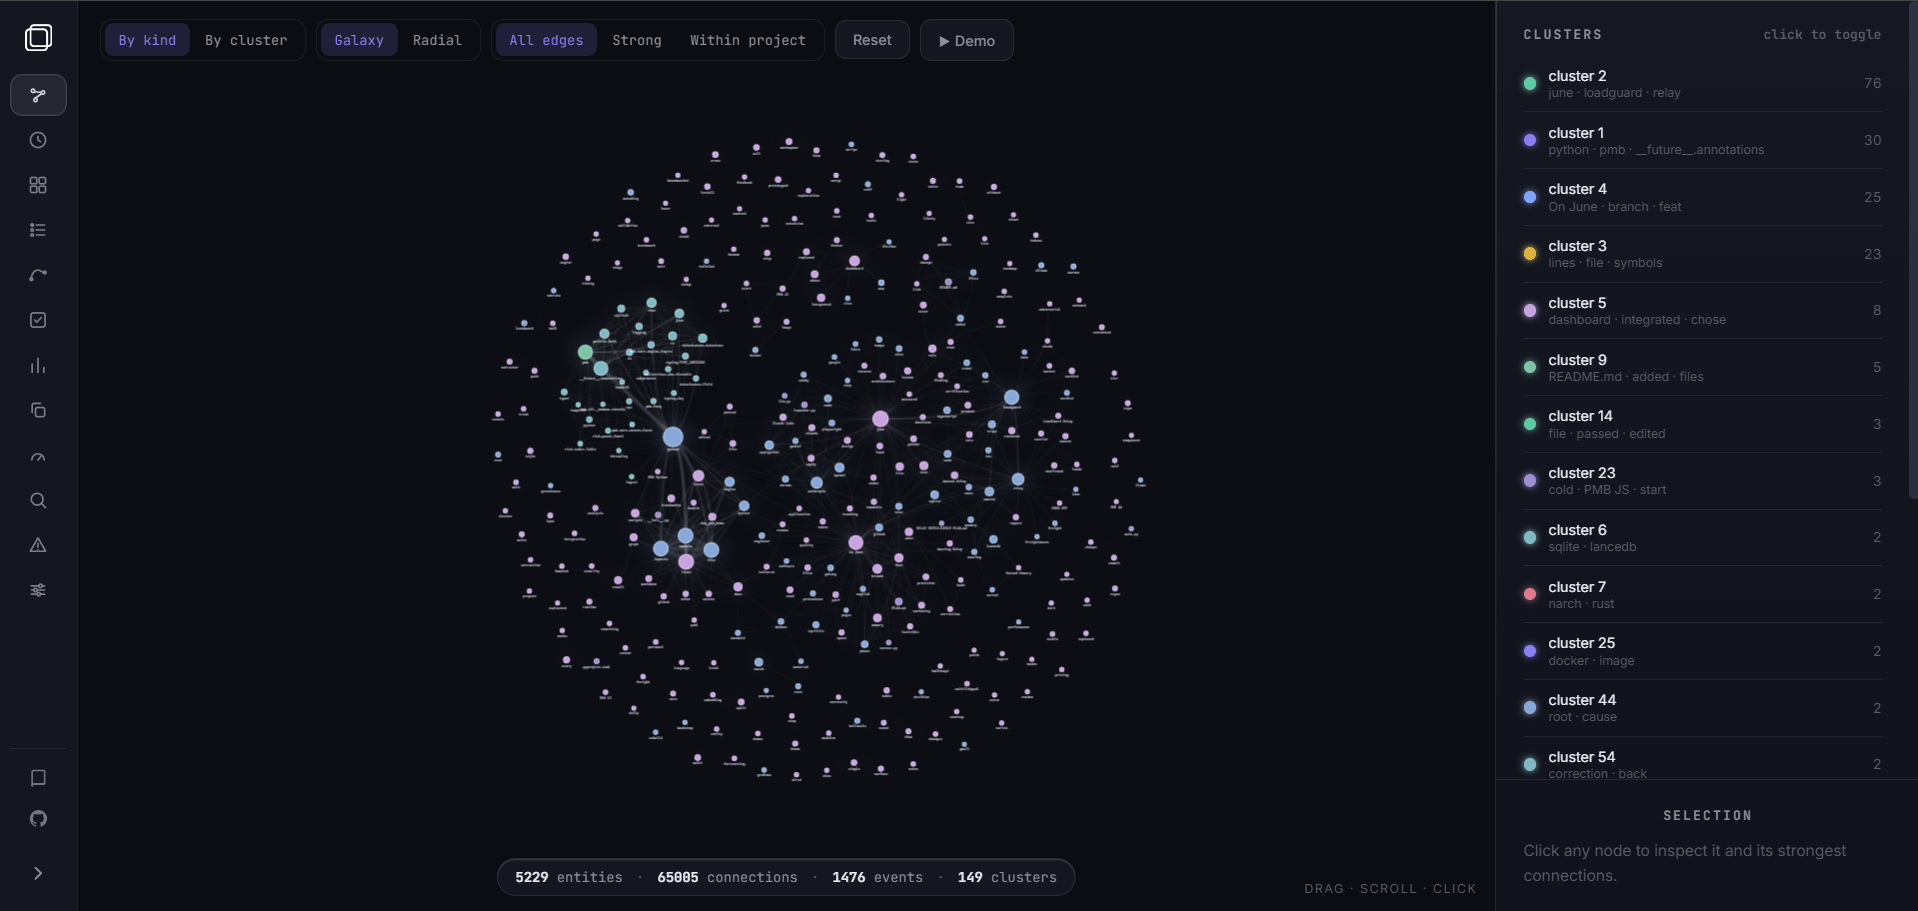
Map
Every entity and connection as a live force-directed graph - people, files,
projects, decisions; color by type, size by degree.
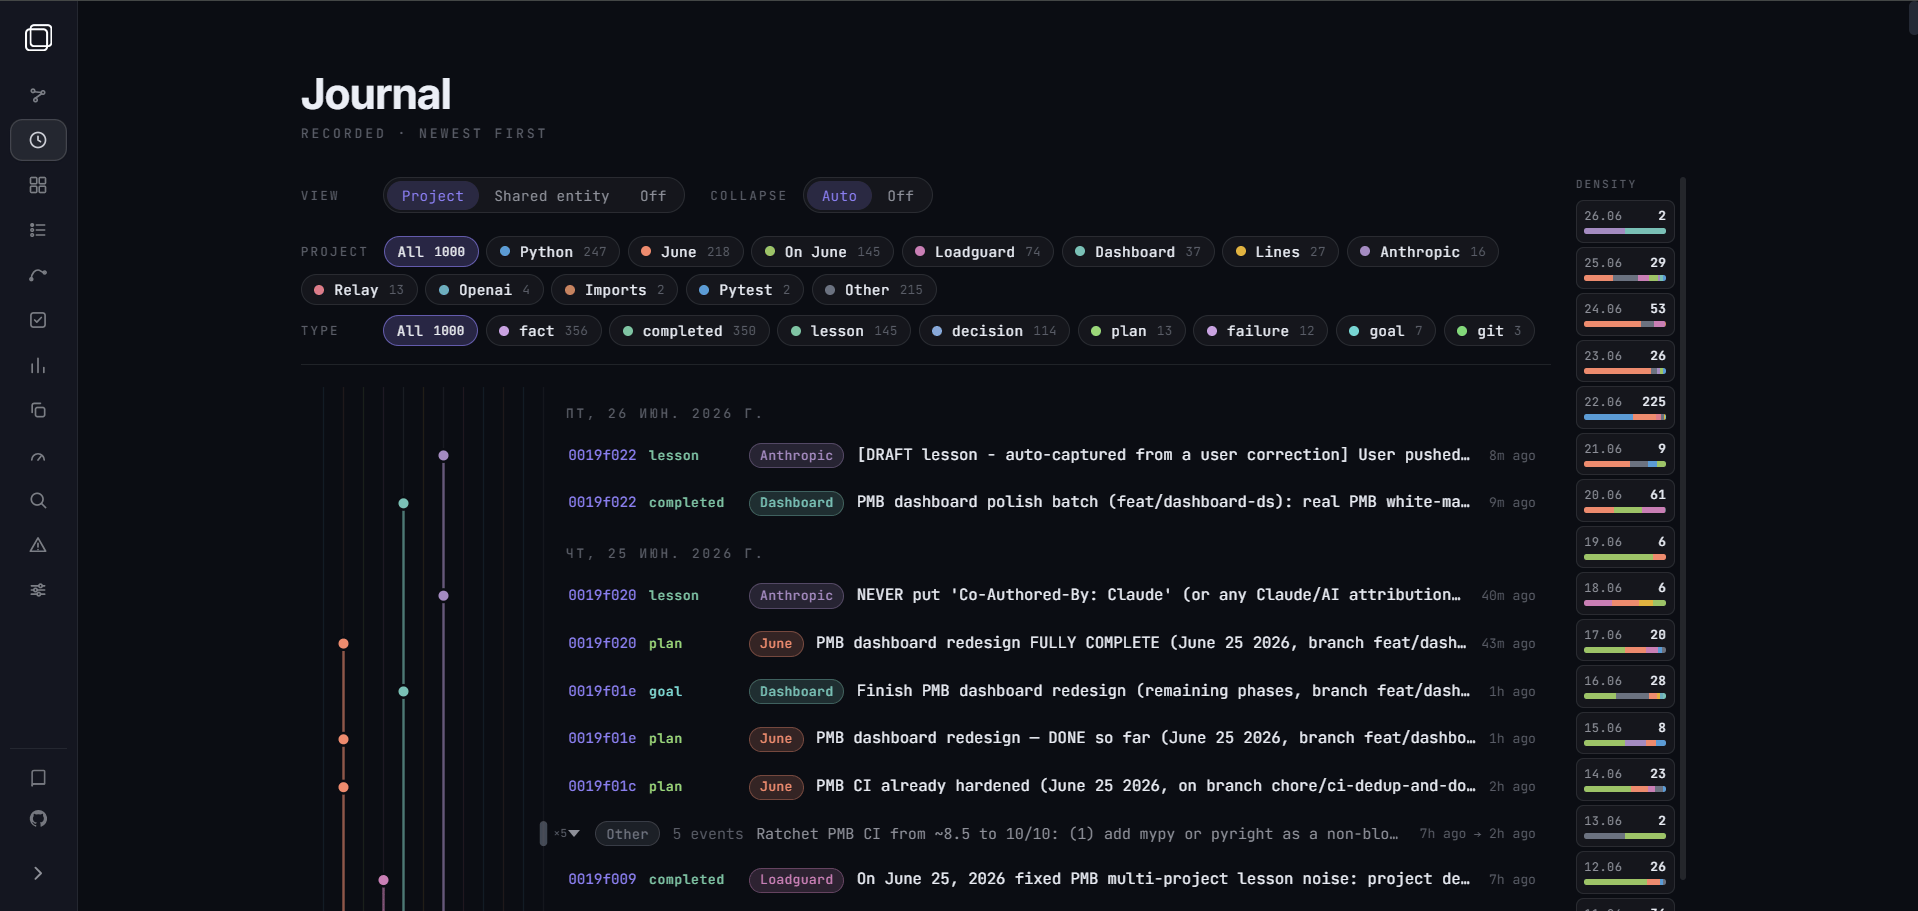
Timeline
Your memory as a journal, git-graph by project, newest first.
Lessons
Per-rule follow-rate and dead-lesson detection - see which rules pull weight.
Recall
A ranker debugger: run a query and see why each result scored as it did.
Duplicates
Borderline duplicate pairs, with inline merge.
Performance
Per-tool latency from the MCP telemetry.