> ## Documentation Index
> Fetch the complete documentation index at: https://docs.pmbai.dev/llms.txt
> Use this file to discover all available pages before exploring further.
# The dashboard
> A local web UI over everything PMB captured - your memory as a live graph and timeline.
```bash theme={null}
pmb dashboard # http://127.0.0.1:8765, or the next free port
```
It binds to `127.0.0.1` only - nothing leaves your machine.
 ## The tabs
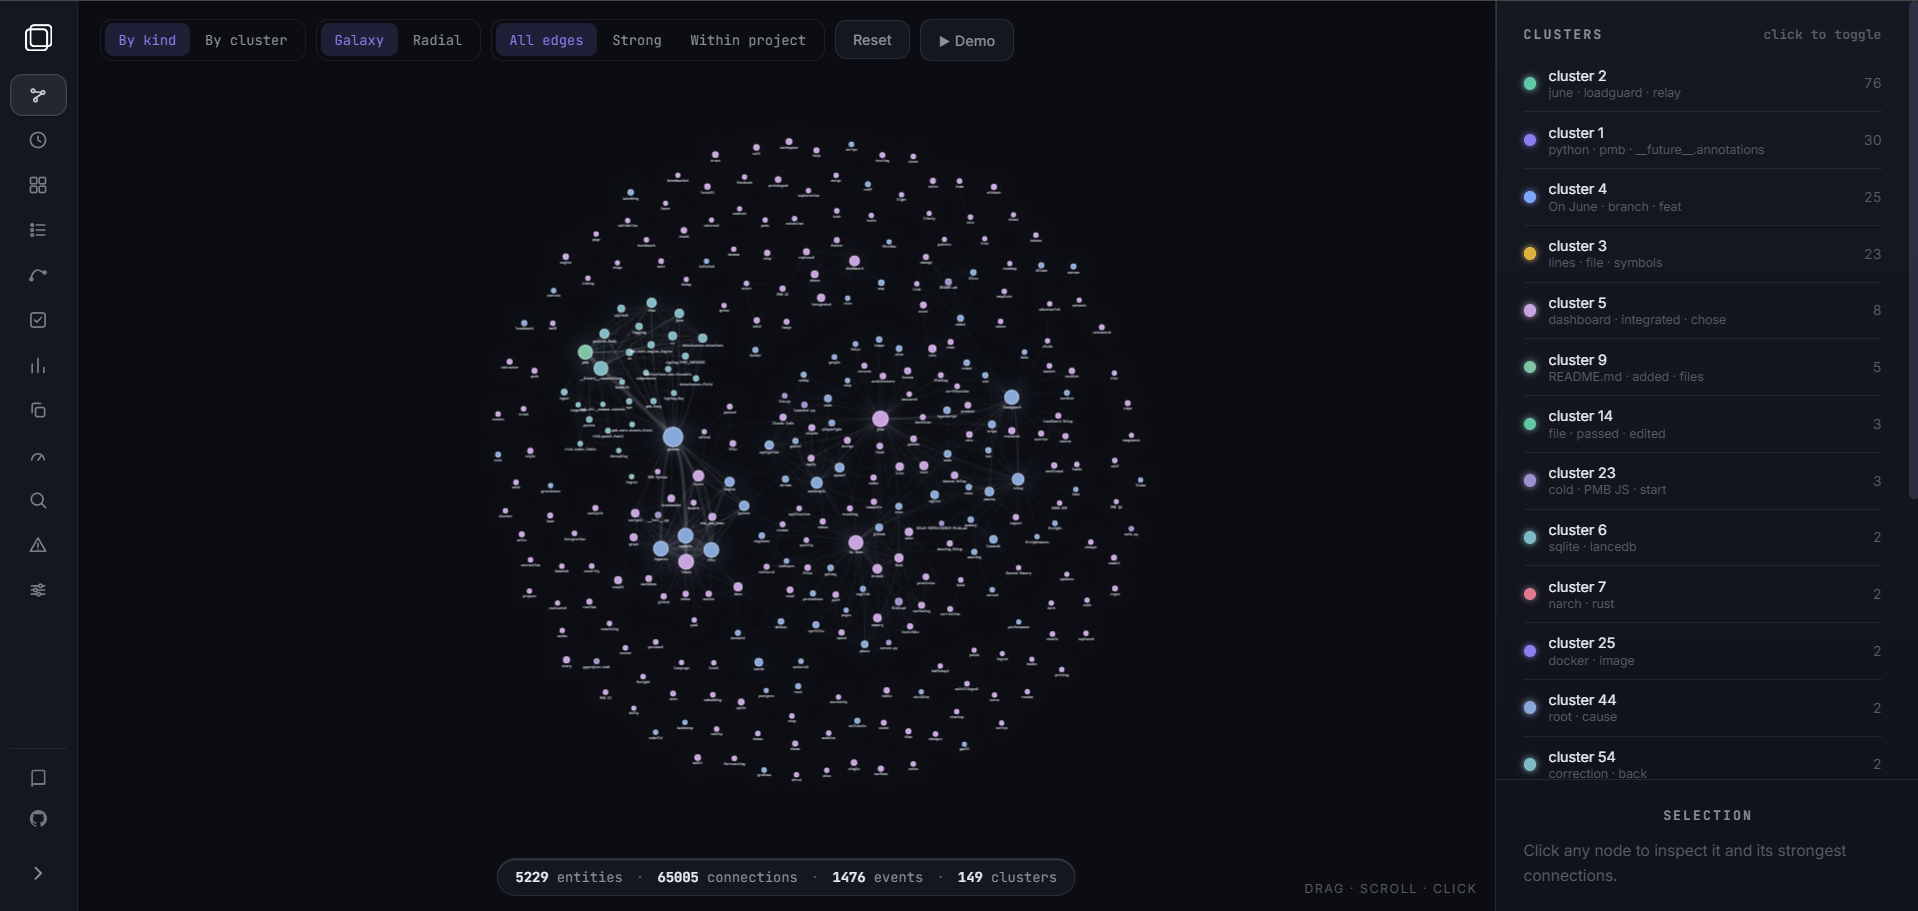
Every entity and connection as a live force-directed graph - people, files,
projects, decisions; color by type, size by degree.
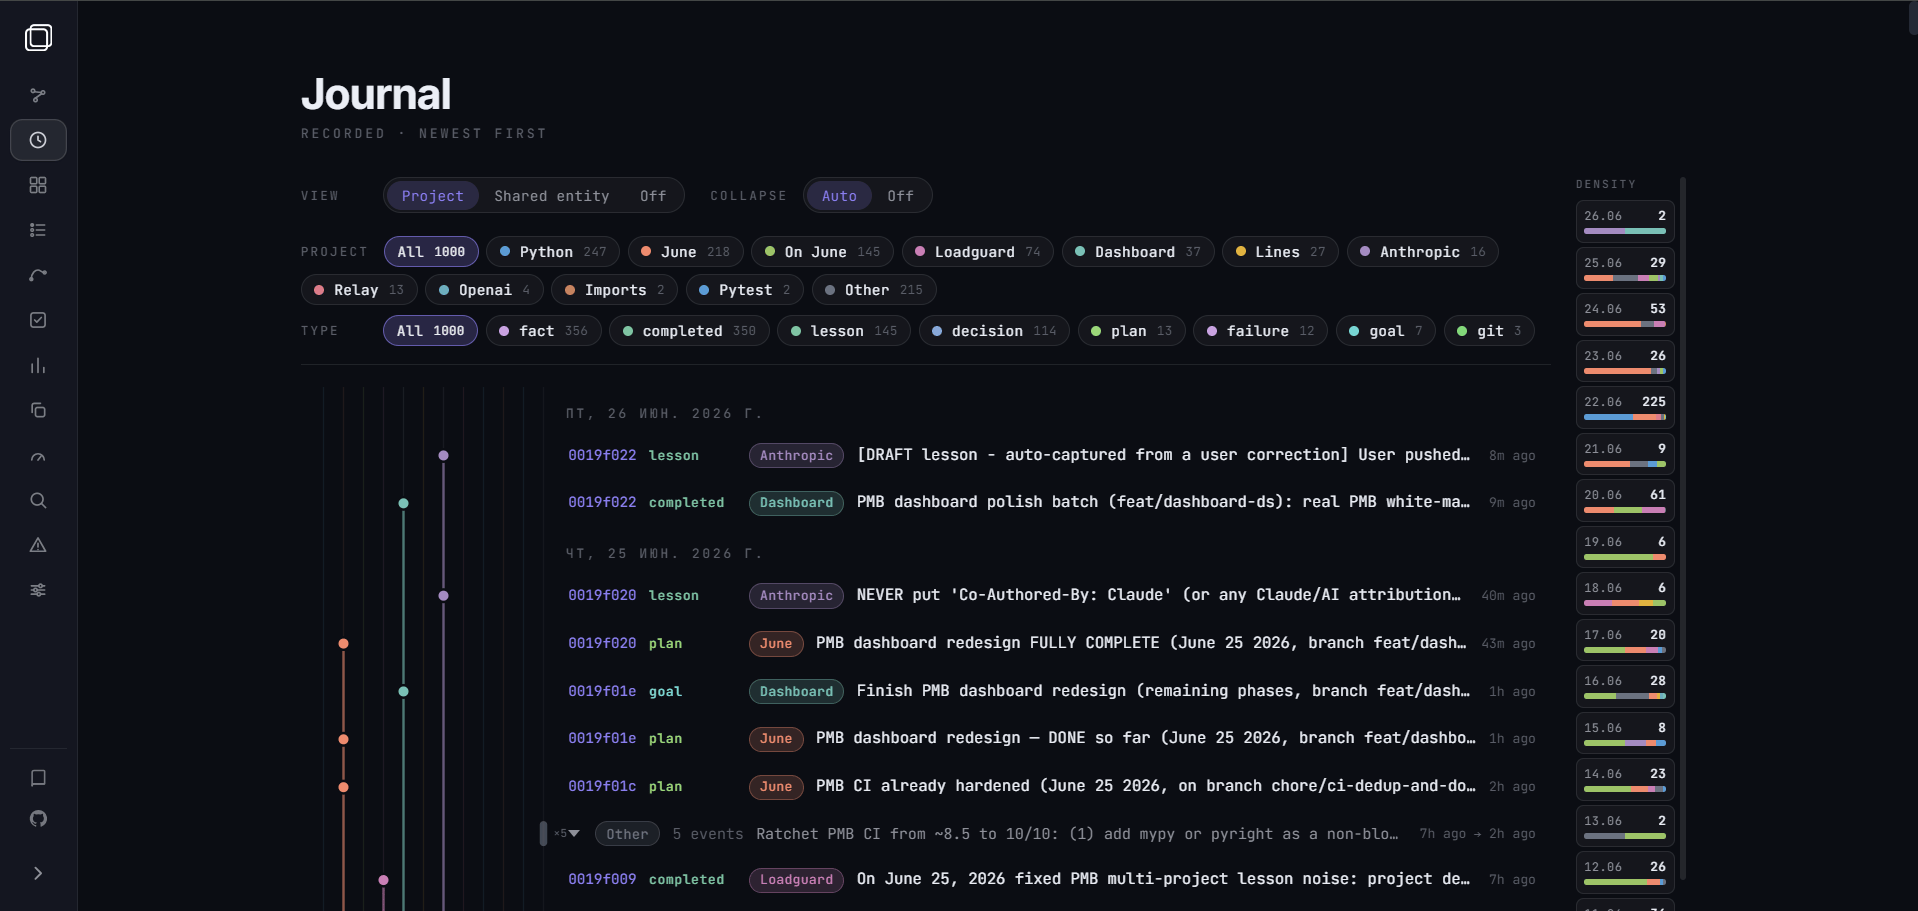
Your memory as a journal, git-graph by project, newest first.
Per-rule follow-rate and dead-lesson detection - see which rules pull weight.
A ranker debugger: run a query and see why each result scored as it did.
Borderline duplicate pairs, with inline merge.
Per-tool latency from the MCP telemetry.
Plus **Overview**, **Entities**, and **Arcs** (narrative threads).
## The tabs
Every entity and connection as a live force-directed graph - people, files,
projects, decisions; color by type, size by degree.
Your memory as a journal, git-graph by project, newest first.
Per-rule follow-rate and dead-lesson detection - see which rules pull weight.
A ranker debugger: run a query and see why each result scored as it did.
Borderline duplicate pairs, with inline merge.
Per-tool latency from the MCP telemetry.
Plus **Overview**, **Entities**, and **Arcs** (narrative threads).
 The dashboard and the MCP HTTP server both default to port `8765`. If the
default dashboard port is busy, `pmb dashboard` auto-skips to the next free
port. Use `pmb dashboard --port 18888` when you want a fixed port.
The dashboard and the MCP HTTP server both default to port `8765`. If the
default dashboard port is busy, `pmb dashboard` auto-skips to the next free
port. Use `pmb dashboard --port 18888` when you want a fixed port.